Alarm Management IT Monitoring
IT Alarm Management - important requirements and recommendations
11.02.2021 |
IT organizations of large companies are faced with 5 critical and about 80 less critical alarm...

NEED FOR SPEED. Every millisecond counts. At least for business-critical web services such as online banking or online shops. “A 100 millisecond delay in the response time costs Amazon 1% of sales”, said Greg Linden, the inventor of the recommendation system at Amazon. If products are not loaded immediately and search results are not displayed promptly, many online shoppers break off the shopping process and stay away permanently – a very poor user experience, a worst case scenario. Availability and performance are the two critical success factors that monitoring systems are now used to ensure. But professional monitoring applications can do much more than these basic goals. The following blog post shows how active monitoring in combination with capacity and alarm management can guarantee compliance with SLAs and cost-effective IT operations - especially in view of complex hybrid IT landscapes. Your investment in the corresponding technologies will pay off within a few months.
A comprehensive and homogeneous monitoring system is an important key to master the complexity of hybrid environments. Business transactions, applications and the infrastructure should be controlled in a sovereign manner. To monitor them, multiple non-integrated solutions are frequently used in companies, such as SAP, Nagios, Splunk, Automic, Oracle Enterprise Manager or other database or network tools. It is not unusual for large, international organizations to have up to 20 of such isolated monitoring systems ― some of them distributed all over the world. Most of them have evolved over time ― in line with the expansion of the IT infrastructure.
In practice, concurrent isolated systems do not only lead to significant additional expenses for operating redundant tools. There is also no cross-system 360° view with this „silo-based“ monitoring approach, which is so important in cases of emergency. There can be serious consequences. For troubleshooting usually is difficult and very time-consuming. It is also delayed because every system administrator first checks his own views. An additional drawback of an isolated view is that you cannot properly assess how serious a malfunction and its effect on customers or your business is.
Holistic umbrella monitoring reduces your direct and indirect expenses and has, among other things, positive effects on the following aspects:
The holistic experience of perfectly functioning applications is only possible at the "point of customer", i.e. in front of the screen. And this is ensured by the supplementary E2E monitoring. Experience shows that monitoring individual technical components of an IT service alone is not enough. Although databases or web servers may work smoothly, any downstream applications might not. There can be very many reasons, such as a badly programmed user interface or slow loading times after a software update.
Therefore, it is necessary to monitor the entire spectrum of physical, process-related and application-related data, which is aggregated and displayed centrally via multi-client capable dashboards. At a glance, the availability of the systems and the performance of the connections can be displayed in real time from the perspective of the end user.
Proactive error avoidance:
A regular quality check allows to identify emerging weaknesses and system bottlenecks in due time, e.g. constantly increasing loading times. It is important not only to monitor SLAs. In fact, all data recorded by the end-to-end monitoring across the entire delivery chain must be used. If critical threshold values are reached, the system automatically alerts the relevant experts in charge. Ideally, they take remedial action proactively – even before end users are affected.
Service level monitoring:
Real performance data are compared to indicators defined in IT services. This makes it transparent if service level agreements (SLAs) have been met or violated. SLA violations may incur income and productivity losses, legal sanctions, decreased brand values and a loss of regular customers – the damage can easily run into the millions. E2E monitoring helps to avoid SLA violations and fines resulting thereof. On the other hand, E2E monitoring serves as instrument of quality assurance to service customers in order to validate the performance of outsourcers or service providers. Classic monitoring systems reach their limits particularly when third-party service providers should be monitored. State-of-the-art SLA management needs to have specific monitoring checkpoints for analyzing problems with SaaS, DNS or API services.
But monitoring systems not only save your company’s money in the event of an emergency - they also help to make IT operations as economical as possible when it comes to everyday problems. According to Gartner, $14.1 billion dollars were wasted on unnecessary cloud resources. This figure is expected to rise to 21 billion by 2021. This means that over a third of global cloud expenditure is unnecessary. Since cloud applications are often ordered by departments according to the "all you can eat" principle but are not or only partially consumed, it is important to take a look at their use, which is supported by monitoring and alerting systems.
Based on defined threshold values, the automatic monitoring and notification system identifies certain cloud systems as “operational but idle”. Since an “up and running” entails continuous payments to cloud providers such as AWS, those responsible are informed of the situation. The notification includes a number of alternatives for improving the situation. The system generates these suggestions automatically. The options are as follows: “Start using as planned”, “Let’s downsize the service to a smaller/cheaper system until you need this computing capacity”, or “Let’s cancel the system in order to avoid payments to AWS (and request a new system when you really need it)”. The notification is sent to the head of the cost center, who immediately knows from the cost allocation which costs are incurred for this service. The escalation level provides for an automatic system-side computer shutdown if certain criteria are fulfilled.
In addition to pure real-time monitoring, capacity or performance monitoring ensures that the IT capacities available meet both current and future requirements. An integrated „monitoring screen“ for all performance data enables them to be combined and condensed in a uniform structure and view. On the one hand, the capacities of certain resources or components required for services, systems and applications can be measured; on the other hand, automated data analyses including historic values result in forecasts and trends that are used to prioritize, optimize and plan capacities. Clear dashboards for different roles, e.g. service owners, departments, control centers or management, provide the required information at a single glance. And if capacity bottlenecks or other concrete problems are imminent, alarm management comes into play. This is how to balance economic efficiency and performance – even when purchasing external capacities on demand.
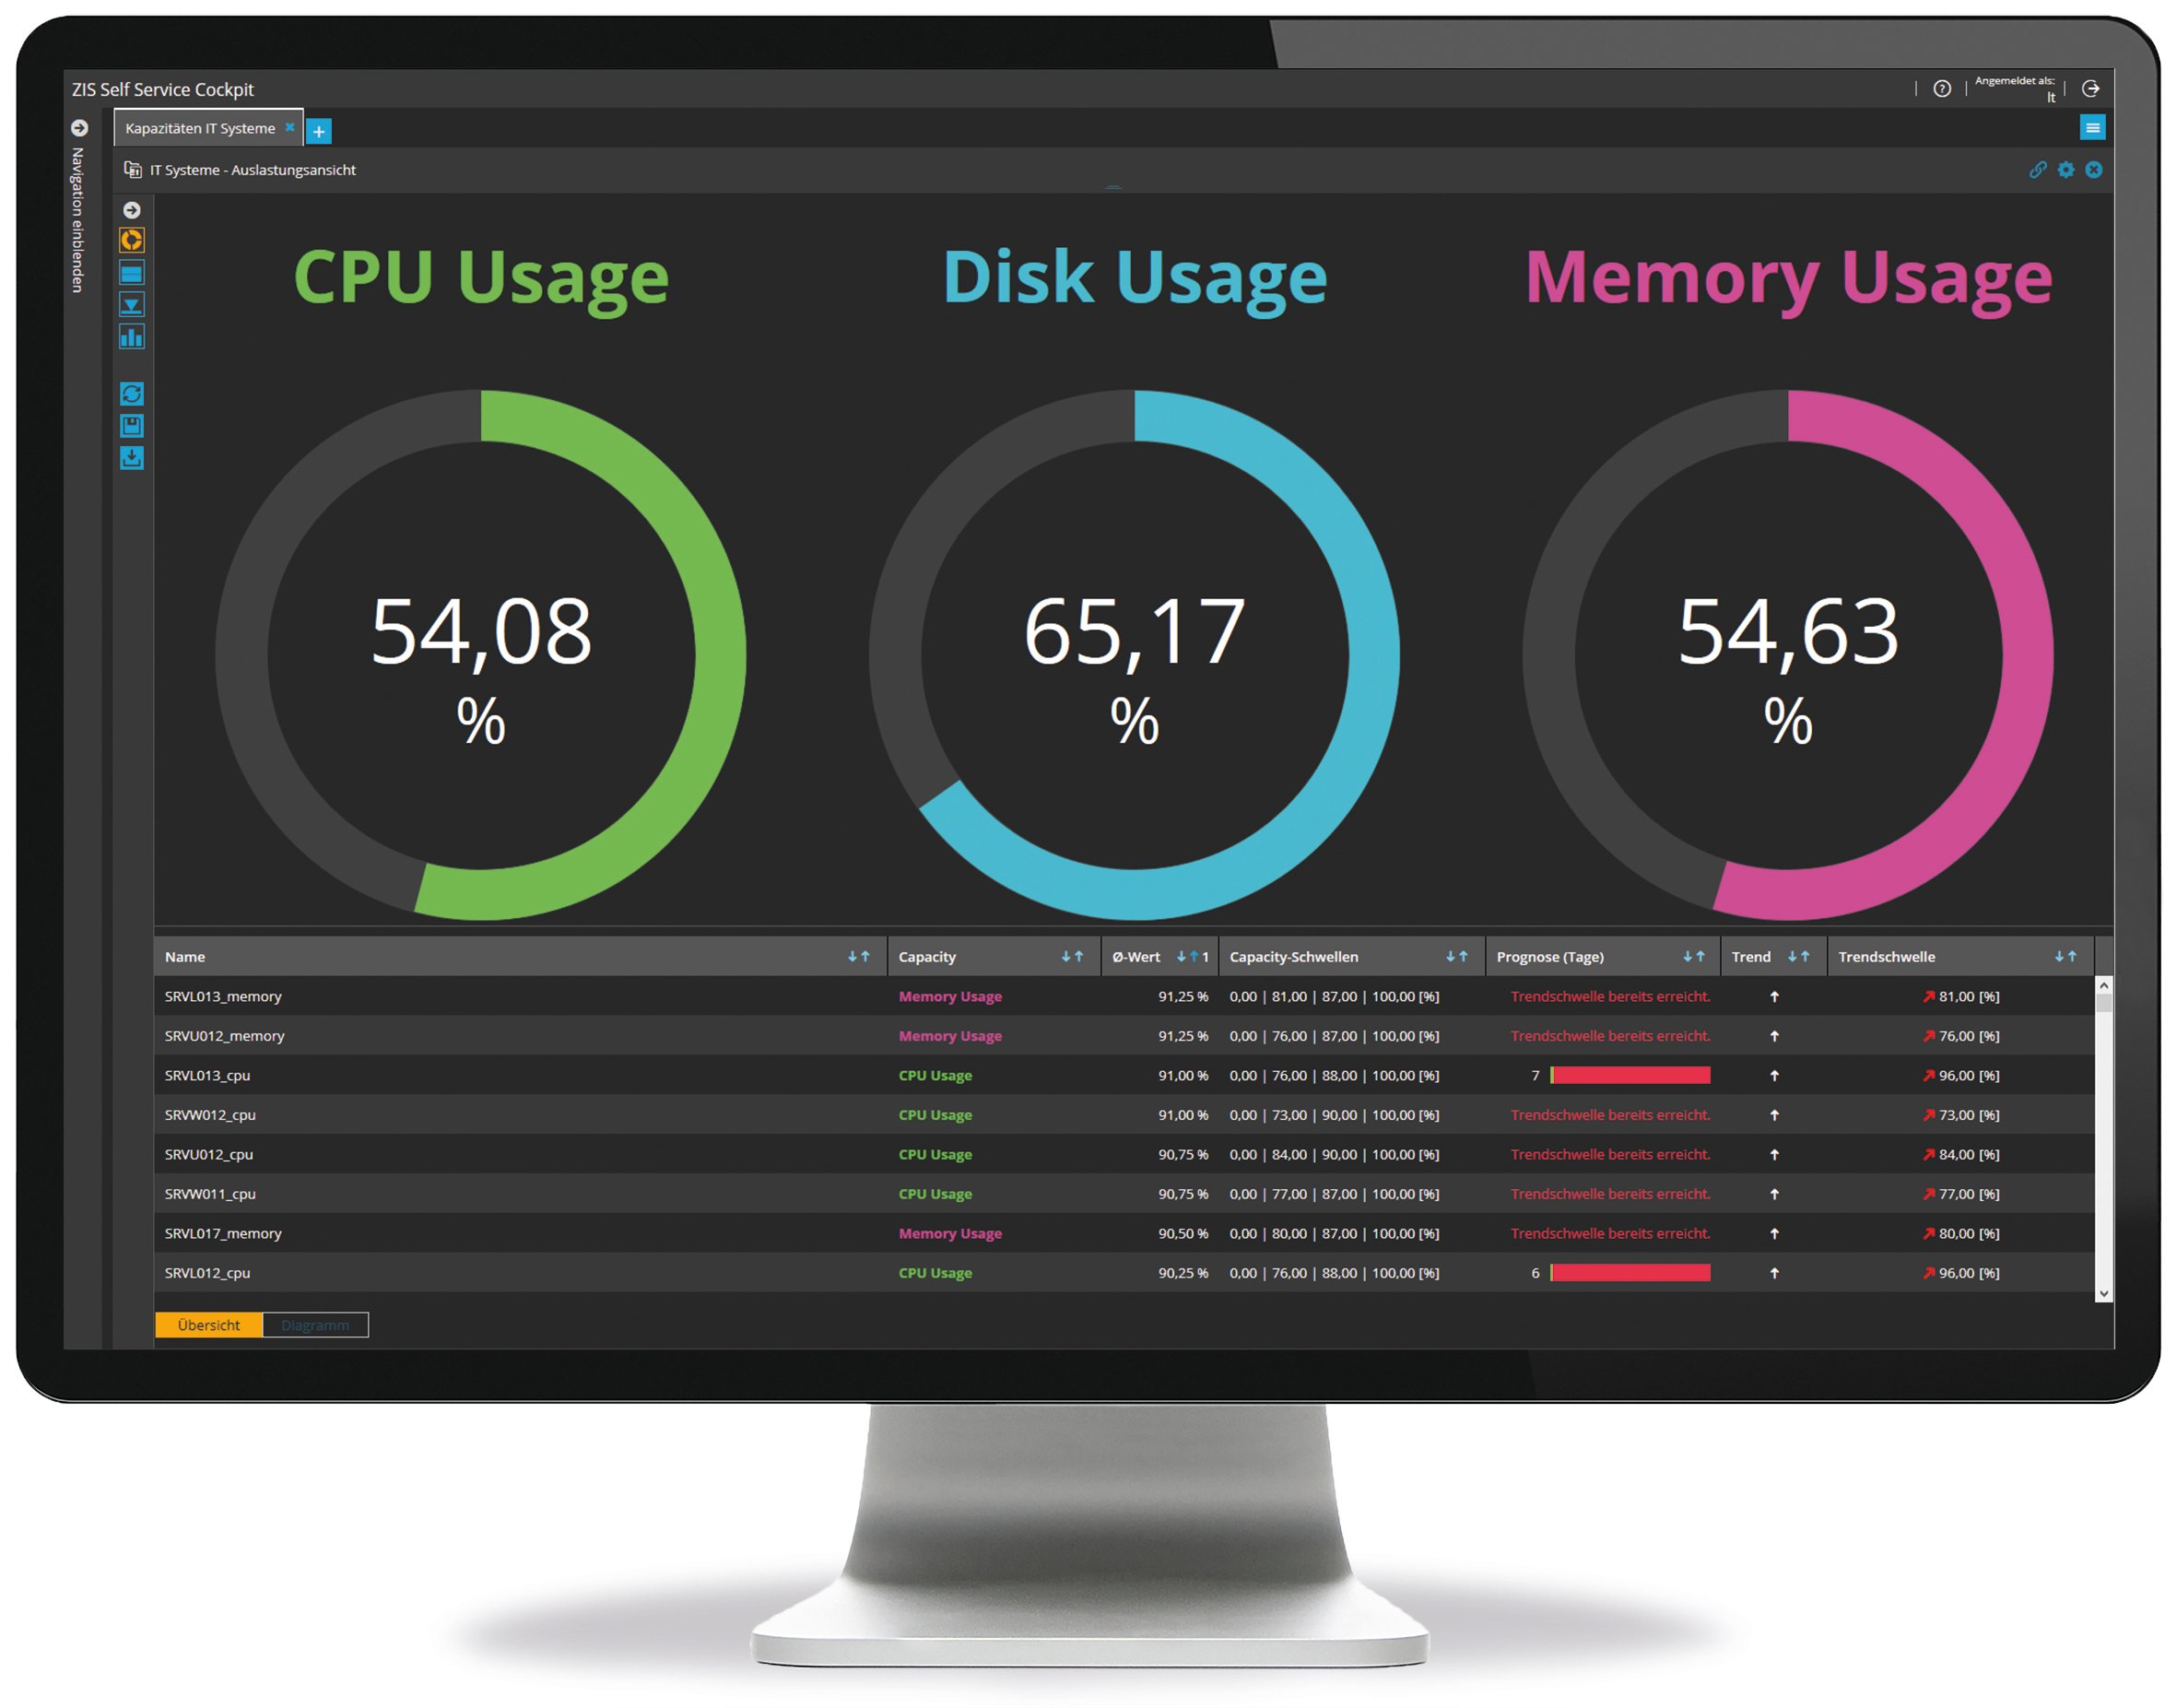
Fig. 1: Dashboard Capacity Management
An essential lever for minimizing ticket costs is integrated centralized monitoring. It filters and classifies information on occurring malfunctions. Integrated ticket correlation automatically evaluates the wealth of generated data focussing on relevant information. From the large number of events, only those tickets that are really important are aggregated and sent to the service desk for further processing. The service desk receives additional relevant information on the affected CIs, the error etc. This not only reduces the number of tickets by around a third - the quality of the tickets also increases significantly and the processing time is reduced.
Thus, the following conservative ROI calculation is realistic: With 60,000 tickets per year (5,000 per month), above correlation systems allow to save approx. 18,000 tickets. If 15 € per ticket are assumed, potential savings amount to at least 270,000 € annually. Any investment in a comprehensive monitoring system including an event correlation module should amortize within a short time.
Are your services 100% available? Do you fix occurring IT disturbances quickly, directly and proactively? Are your customers and your customers’ customer enthusiastic about the performance of your online services? Can you monitor the SLAs of your external service providers in real time and act quickly? Is the relationship between existing IT assets or cloud resources and usage correct at all times or can you react quickly to changes? Can your service desk concentrate on the really important tickets and process them quickly with the help of a system - while maintaining high service quality?
With an integrated and professional overall monitoring solution, you can answer YES to any of these questions - and thus minimize costs and risks.
Alarm Management IT Monitoring
IT organizations of large companies are faced with 5 critical and about 80 less critical alarm...
Cloud Monitoring Hybrid Cloud Computing
Only a few years ago, simple client/server structures needed to be monitored whereas today it is...
Everyone loves an open bar, but few are happy to pay to host one. Cloud costs can just as quickly...